The dashboard displays the current status of your group for the day, offering a concise summary of the most critical team metrics. It highlights employee activity and productivity so you can quickly understand performance, spot trends, and act on issues.
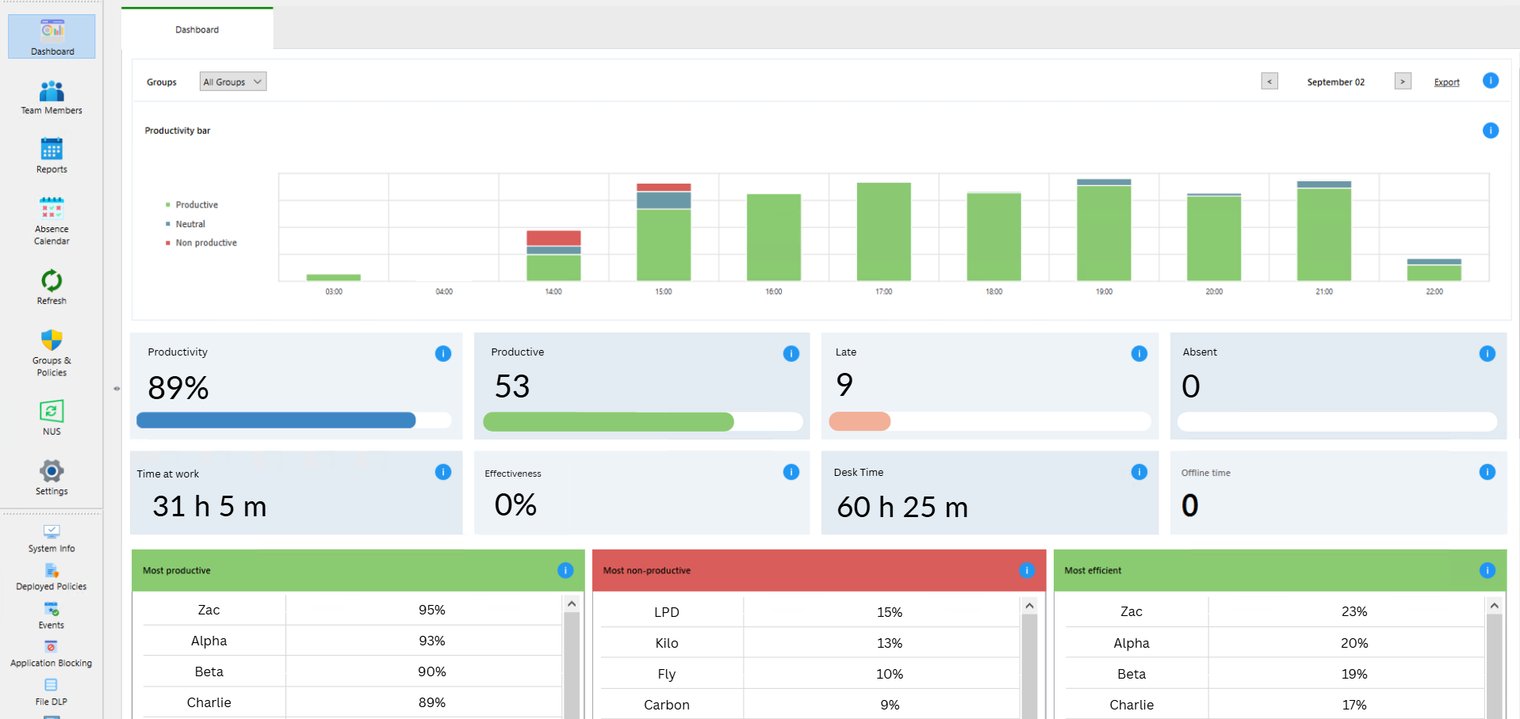
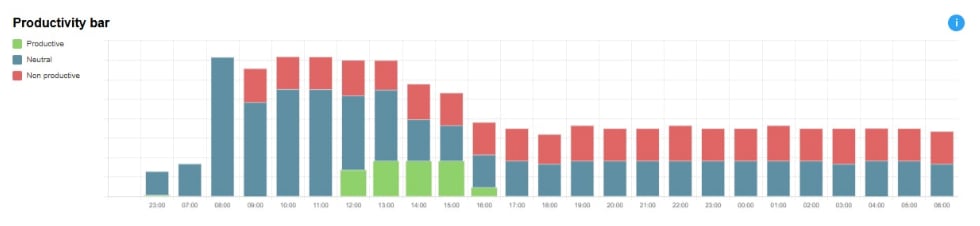
Productivity bar - Visually displays Productive, Non-productive, and Neutral zones on a clear, color-coded graph for quick and easy viewing and interpretation. It provides an at-a-glance representation of how time or tasks are distributed across productive, non-productive, and neutral activities, enabling fast assessment of overall efficiency and helping users identify areas for improvement.
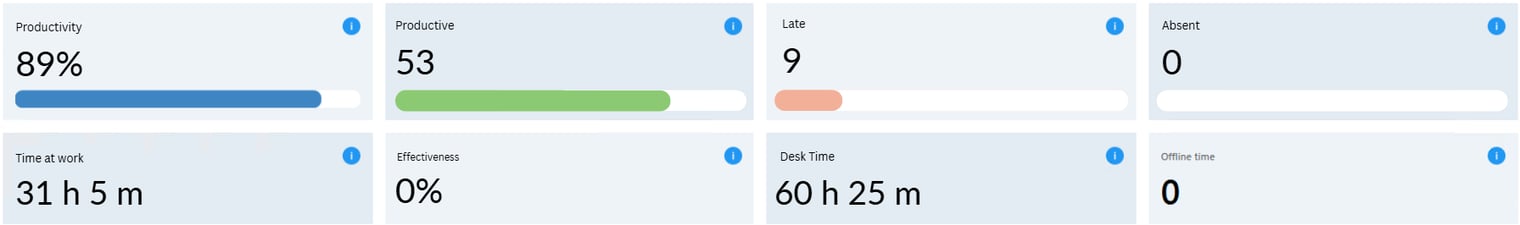
Workforce Performance Indicators - Metrics that track employee productivity, efficiency, attendance, and goal attainment to evaluate individual and team performance and guide improvement efforts.
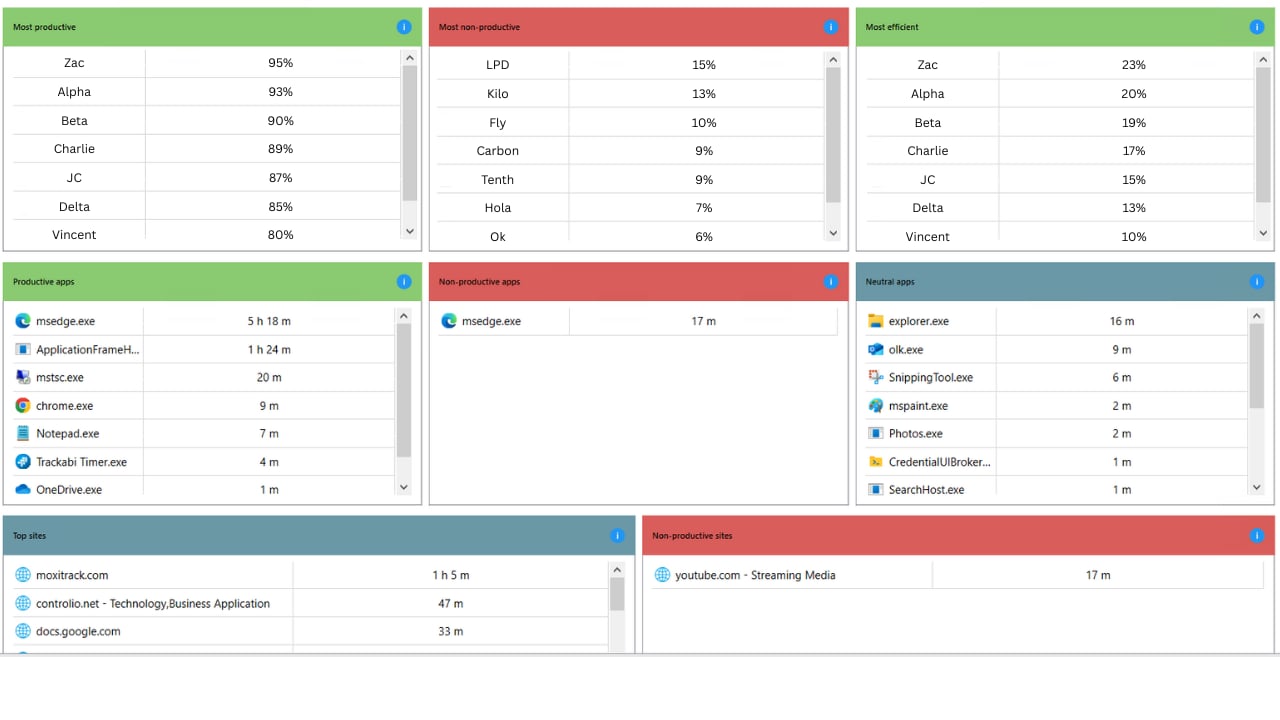
App & Website Productivity Analytics - Tracks user activity on applications and websites to measure productive versus non-productive time, identify usage patterns, and provide insights for improving digital workplace efficiency.